
Amazon is the world's largest online store. It also has one of the most layered fee structures in retail. Yet every year, thousands of sellers set their prices, ship their inventory, and start selling, without ever doing the full math. The cost to list on Amazon is not one fee. It is a combination of charges that stack quietly on top of each other until your revenue and your profit look nothing alike.
According to Wikipedia’s summary of Amazon’s marketplace model, Amazon charges third-party sellers multiple fees, including referral fees, fulfillment fees (for FBA), and storage fees, which together form a significant portion of the transaction value deducted before profit is realized.
Most sellers only discover this after they are already live. That is exactly the problem Xneeti's AI platform was built to solve, helping sellers see every cost layer before it hits them. This guide gives you that same clarity on how much it costs to sell on Amazon in 2026, so that it does not feel like a mystery anymore.
What Does Selling on Amazon Actually Cost You?
Most sellers spend 15–35% of their revenue on Amazon fees before accounting for product cost, shipping, or advertising. This is the baseline cost of selling on Amazon, and it often comes as a surprise because it is not presented as a single number anywhere.
This does not mean Amazon is not worth it. It means going in without mapping these costs is what makes it unprofitable for so many sellers.
Every charge you will encounter falls into one of five categories:
- Referral fees: Amazon's cut of every sale, calculated as a percentage of the selling price.
- Subscription fees: Your monthly or per-unit cost just to have a seller account.
- Fulfillment fees: What you pay to pick, pack, and ship each order, whether through FBA or your own setup.
- Storage fees: The monthly cost of keeping your inventory in Amazon's warehouses.
- Optional service fees: Things like Vine enrollment, A+ Content, and account tools that are not mandatory but are often necessary.
According to Amazon's own fee overview, the exact amount you pay depends on your product category, fulfillment method, selling plan, and how your inventory moves.
Which Selling Plan Should You Start With?
If you are selling more than 40 units a month, the Professional plan at $39.99/month works out cheaper than paying $0.99 per item on the Individual plan. That is the straightforward math. But the plan you choose affects more than just the cost to list on Amazon, it also determines what tools and features you can access.
Here is how the two plans compare:
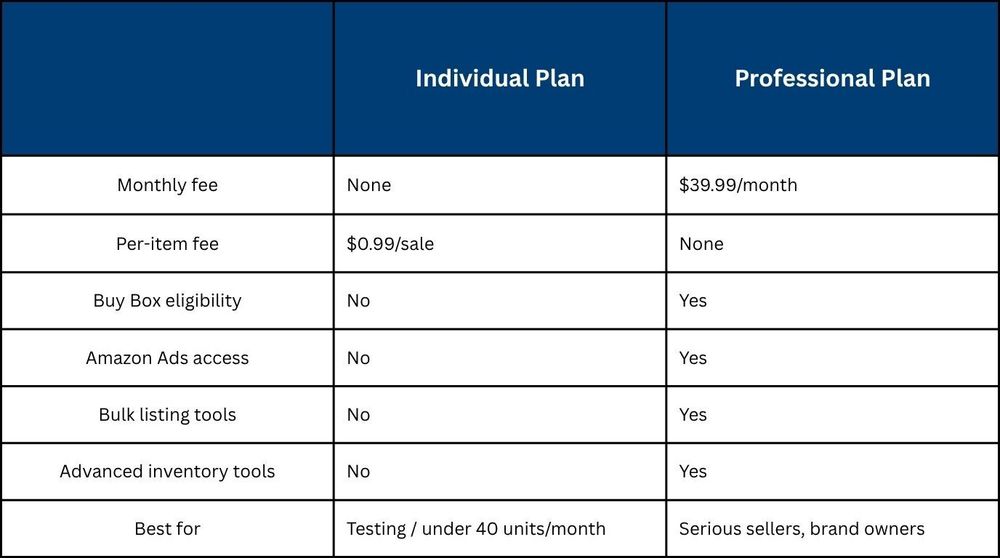
As explained in Amazon’s official breakdown of Individual vs Professional selling plans, the Professional plan gives access to advanced tools designed for growth, including bulk listing, advertising, and detailed reporting.
Referral Fees by Category: What Percentage Does Amazon Take?
Amazon takes a percentage of every sale as a referral fee, typically ranging from 8% to 45%, with most categories averaging around 15%. This fee is non-negotiable and applies to every transaction, making it one of the most significant components of your Amazon referral fees by category.
In simple terms, this is Amazon’s commission for giving you access to its marketplace.
Here’s a simplified breakdown of common categories:
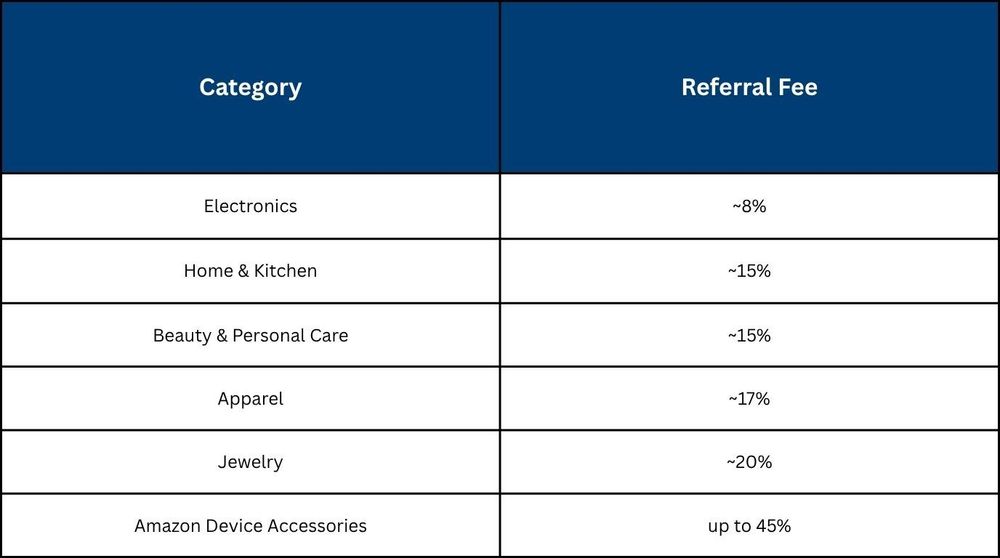
Another detail often missed is the minimum referral fee, usually $0.30 per item. This becomes critical for low-priced products, where the percentage-based fee might be lower than the minimum, effectively increasing your cost of selling on Amazon.
FBA vs. FBM: Which Fulfillment Model Actually Costs Less?
FBA usually costs more per unit, but it often leads to higher conversion rates and better Buy Box visibility. FBM can be cheaper in certain cases, especially for heavy, slow-moving, or high-margin products. The right choice depends on how your product behaves, not just what the fees look like in isolation. This is where understanding an Amazon FBA fees breakdown becomes critical.
How does FBA pricing actually work in 2026?
With Fulfillment by Amazon (FBA), you pay Amazon to store, pack, and ship your products. The cost structure includes:
- Fulfillment fee (based on size and weight tier)
- Monthly storage fee (higher in Q4)
- Aged inventory surcharge (for stock held over 180 days)
As outlined in Amazon’s FBA fee structure and size-tier pricing model, fulfillment fees in 2026 typically range from around $3 to over $75 per unit, depending on size and weight, while storage can increase from about $0.75 to $2.40 per cubic foot during peak season.
This means your per-unit cost is not fixed. It changes based on:
- packaging size
- weight classification
- How long inventory sit in storage
What does FBM really cost beyond shipping?
Fulfilled by Merchant (FBM) looks cheaper on the surface because there is no FBA fee. But the actual cost structure includes:
- Packaging materials
- Carrier shipping rates (which fluctuate)
- Customer service handling
- Returns processing and logistics
These are not always tracked properly, which is why many sellers underestimate their real Amazon seller fees 2026 when operating FBM.
When should you choose FBA vs FBM?
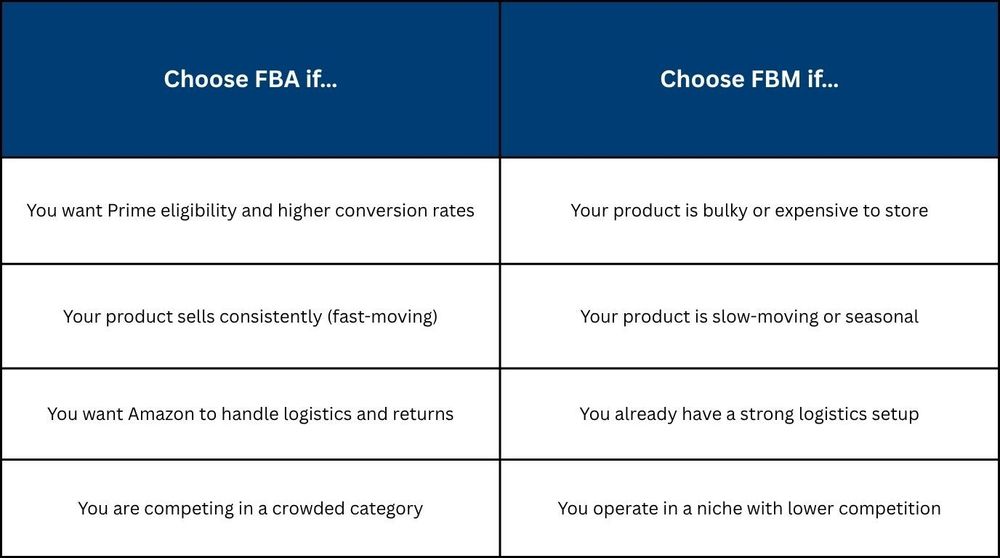
What most sellers get wrong
The decision is often made based on cost per unit alone, but that is incomplete.
- FBA may cost more → but can increase conversion rate
- FBM may save money → but reduce visibility and Buy Box share
In practice, this means the “cheaper” option is not always the more profitable one.
For sellers trying to estimate the true cost to list on Amazon, fulfillment is not just an operational choice. It directly affects revenue, conversion, and ultimately, profitability.
Is Advertising on Amazon Optional in 2026?
No. For any competitive product, advertising is no longer optional, it is a structural cost. Most sellers should expect to spend 15–30% of their selling price on ads, making it a core part of overall Amazon selling costs.
Why doesn’t organic ranking work alone anymore?
Amazon’s marketplace has changed. There are more sellers, more listings, and more competition for the same search terms.
Advertising now directly affects visibility.
As explained in Amazon Ads’ guide to Sponsored Products and product discovery, these ads appear in search results and product pages, placing your product in front of high-intent shoppers at the moment they are ready to buy.
In practical terms:
- New listings rarely get visibility without ads
- Ads generate the initial traffic needed for conversions
- Conversions help improve organic ranking
How is AI changing product discovery?
Amazon is increasingly integrating AI into how customers discover products. With tools like Rufus, product recommendations are no longer based only on keywords but also on context, behavior, and intent.
At the same time, advertising placements are embedded across the shopping journey.
Research shows that sponsored listings often appear alongside or even ahead of organic results, shaping what customers see first.
This creates a system where:
- Ads influence visibility
- Listings influence conversion
- Both work together, not separately
What is your break-even point on ads?
The simplest way to evaluate ad efficiency is:
Break-even ACoS = Your product’s gross margin (%)
Example:
- If your margin is 30% → your break-even ACoS is 30%
- Anything above that → you lose money
- Anything below → you remain profitable
This is where many sellers miscalculate. They treat ads as an “extra expense,” when in reality, they are part of the core cost structure.
What does Amazon’s own data show?
Amazon reports that Sponsored Products help increase visibility and drive sales by placing listings directly in high-intent search positions.
In fact:
- Sponsored ads appear in search results and product pages
- They connect directly to purchase-ready traffic
- They are designed to improve both discovery and conversion
The Costs Most Fee Guides Don't Mention
Beyond Amazon’s listed fees, most sellers spend an additional $500–$2,500 upfront and monthly on costs that never appear in the official fee schedule. This is where most misunderstandings happen, even after reading detailed Amazon fees explained guides.
These are not optional in practice, they are required to compete.
What are the hidden setup and operating costs?
Most sellers underestimate how much it takes to launch and sustain a product listing that actually converts.
- Product photography: $300–$1,500
High-quality images directly impact conversion. Poor visuals reduce click-through and sales.
- A+ Content creation:
While Amazon provides the feature, creating effective content still requires design and copy effort. As noted in Amazon’s A+ Content guide, enhanced listings can increase sales by improving how products are presented.
- Vine enrollment: ~$200 per parent ASIN
Used to generate early reviews. Sellers also bear the cost of free product units.
- Account management software: $50–$400/month
Tools for keyword tracking, analytics, and automation are often required once you scale.
What about costs after you start selling?
This is where margins quietly erode.
- Returns: Amazon retains the full fulfillment fee and around 20% of the referral fee on returned items. This makes returns one of the least visible but most impactful costs.
- Currency conversion fees: For international sellers, exchange rate spreads and transfer fees reduce net payout.
- Operational inefficiencies: Poor listing optimization, missed keywords, or delayed bid adjustments lead to indirect losses that never show up as a “fee” but still affect profitability.
The True Profitability Formula — Three Real Product Scenarios
The real way to calculate profit on Amazon is simple in structure but often miscalculated in practice:
Revenue – Referral Fee – FBA Fee – Storage – PPC – COGS = Net Margin
Most sellers only subtract product cost and referral fees. That leaves out multiple cost layers, which is why profitability often looks better on paper than it actually is. This is exactly where tools like an Amazon FBA cost calculator 2026 become useful—but even they require complete inputs to be accurate.
Why this formula matters
Profit on Amazon is not defined by revenue. It is defined by what remains after all cost layers are applied.
Research on break-even ACoS shows that many sellers miscalculate profitability because they ignore multiple fees, leading to margins that are significantly overstated.
In simple terms:
- If you miss even one cost layer → your margin is wrong
- If your margin is wrong → your pricing and ad strategy are wrong
Three real product scenarios
Here is how this plays out across different price points:
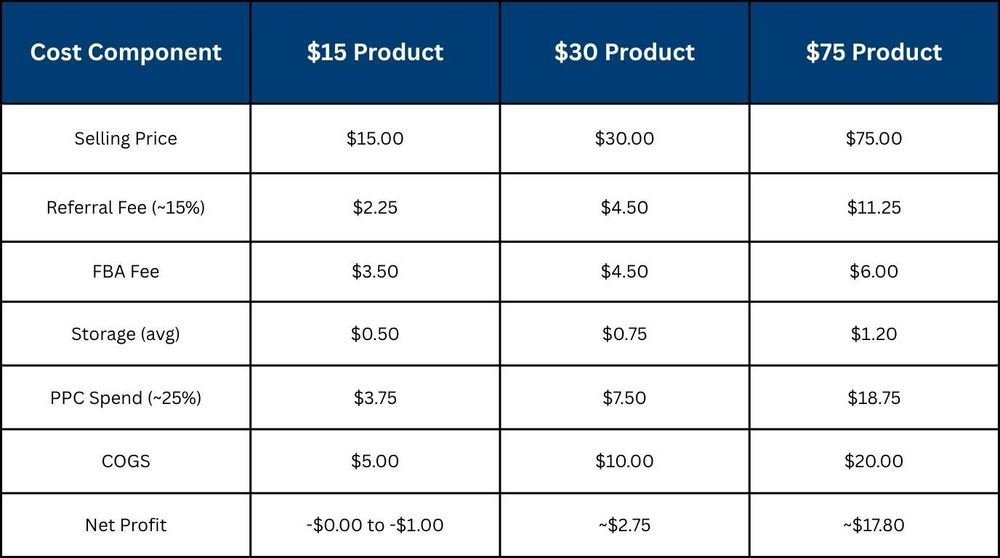
What these scenarios show
Low-priced products ($15):
- Margins are extremely tight
- Ads and fees consume almost everything
- Small inefficiencies turn profit into loss
Mid-range products ($30):
- More stable margin structure
- Enough room to absorb ad spend
- Often, the most scalable range
Higher-priced products ($75):
- Strong margin buffer
- More flexibility in advertising and promotions
- Better ability to handle returns and fee fluctuations
Why Q4 Changes Your Entire Cost Structure
From October 15, Amazon applies peak-season surcharges and higher storage rates, which significantly increase your total costs. If your pricing and inventory are not planned before September, your margins are already at risk. This seasonal shift directly impacts your cost to list on Amazon and operate profitably.
What exactly changes in Q4?
Amazon introduces multiple cost increases during the holiday period
- Storage fees: increase sharply (e.g., ~$0.78 → ~$2.40 per cubic foot)
- Peak fulfillment surcharge: applied per unit from October 15 to January 14
- Aged inventory surcharge: stricter penalties for inventory held over 180 days
How does this affect your margins?
The impact is not limited to fulfillment.
During Q4:
- Ad costs (CPC) can increase by 40–70% in competitive categories
- Conversion expectations rise, requiring stronger listings and higher spend
- Inventory holding costs increase at the same time
Peak fulfillment fees alone can add $0.20 to $1+ per unit, depending on size tier.
Why timing matters more than most sellers expect
Q4 is not just a high-demand period. It is a high-cost period.
- Inventory sent late → risks stockouts or higher aged inventory penalties
- Pricing set too early → may not account for peak fees
- Ads scaled without margin awareness → leads to overspending
Amazon’s own shipping guidance highlights that peak surcharges apply across multiple high-demand windows and must be factored into planning in advance.
How to Model Your Own Costs Before You Launch
Amazon provides a free tool called the FBA Revenue Calculator that allows sellers to estimate fees, profitability, and total selling costs before committing to inventory. This is one of the most practical ways to understand your cost to list on Amazon in advance, especially when evaluating a new product idea.
What does the calculator actually do?
The calculator helps you estimate your per-unit economics by breaking down:
- Referral fees based on category
- Fulfillment fees (FBA or FBM comparison)
- Storage and shipping estimates
- Net profit per unit
What does it miss or underestimate?
While the calculator is useful, it does not reflect the full cost structure of selling on Amazon:
- Advertising spend (PPC is not included)
- Product photography and listing content
- Returns impact and partial fee losses
- External tools or software costs
- Seasonal fee fluctuations (like Q4 surcharges)
These missing elements are often where sellers miscalculate their true Amazon selling costs, especially when scaling beyond a few units.
What should you add manually?
- Estimated PPC spend per unit
- Content creation and listing optimization costs
- Return rate impact (category-specific)
- Seasonal adjustments (Q4 storage and surcharges)
- Operational overhead (tools, prep services, etc.)
The calculator gives a baseline, but profitability only becomes accurate when these real-world variables are included.
How Does Xneeti Model True Profitability for Every Account Using Amazon FBA Fees Breakdown?
Most sellers understand the cost to list on Amazon only after they launch, when fee deductions, ad spend, and storage costs start impacting actual payouts. Xneeti, a multi-marketplace AI platform, addresses this gap by mapping the full Amazon FBA fees breakdown before launch and continuously updating it after sales begin.
Unlike traditional systems, Xneeti is not an agency and not a standalone tool. It functions as an AI-driven operating layer that connects pricing, ads, inventory, and payouts into one live profitability model.
1. Payout Intelligence Across Every Transaction
Xneeti reconstructs every Amazon settlement into a clear, item-level breakdown so sellers understand exactly what they keep after referral fees, fulfillment charges, and deductions are applied to each order.
2. Inventory Cost Forecasting Before Stock Becomes Risk
The system projects storage fees, aging inventory exposure, and replenishment timing so sellers avoid margin loss caused by overstocking or delayed inventory movement.
3. Ad Spend Modeling Linked to True Margin Impact
Instead of treating PPC as a separate expense, Xneeti simulates advertising impact against actual margins, helping sellers understand how every campaign affects profitability before budgets are fully deployed.
4. Real-Time Profit Visibility Across the Entire Account
Xneeti continuously recalculates profit per SKU by combining revenue, Amazon fees, and operational costs, ensuring sellers always know their real-time cost of selling on Amazon and never rely on delayed reporting cycles.
See Your True Amazon Profitability in Real Time
Understanding the full structure of Amazon fees is essential before you launch. Every product carries referral fees, fulfillment costs, storage charges, advertising spend, and hidden operational expenses that together define the real Amazon selling costs. When these layers are calculated in advance, sellers can price accurately and avoid margin surprises after launch. Profitability on Amazon is not accidental, it is built through complete cost visibility from day one.
Xneeti helps sellers remove this guesswork by mapping every cost layer in real time across Amazon and Walmart. It turns complex fee structures into clear decisions that protect margins and improve scaling confidence. Book your demo now and start understanding your true profitability with Xneeti today.


